
This Google Analytics tutorial will show you how to track website traffic, understand visitor behavior, and measure what’s actually driving growth.
This Google Analytics tutorial is designed specifically for beginners who want clarity without technical overwhelm.
First thing first.
Google Analytics (GA4) is a free tool that shows you what people do on your website. But why is it so important?
Imagine running your business with your eyes closed.
Reality Check:
Most businesses install GA4…
80% never check it properly again.
They collect data but never use it.
That’s not analytics. That’s decoration.
And decoration doesn’t grow revenue.
You post on social media, run ads, write blogs, and invest your time and money, yet you have no idea what’s actually working.
For example, if you’re using Facebook for lead generation, here’s a step-by-step guide on setting up a Facebook Business Page correctly.
You don’t know which platform brings real customers. You don’t know which page is making visitors leave. You don’t know which traffic source is generating sales.
If you’re completely new to digital marketing and still understanding the basics, start with this foundational guide on digital marketing for beginners.
That’s exactly why Google Analytics matters. But, if you simply create an account and start clicking around, you’ll likely feel overwhelmed. There are dozens of metrics, reports, and charts. It’s easy to track the wrong numbers, misunderstand the data, and make costly mistakes.
So, read along to know everything in this GA4 tutorial. And if you’re building your marketing stack from scratch, explore these free marketing tools for beginners to support your journey.
Table of Contents
📌 Most Read on Digistir360
👉 Learn digital marketing step-by-step as a beginner
👉 Avoid these common Google Ads beginner mistakes
👉 Master Answer Engine Optimization (AEO)
TL;DR: Google Analytics Tutorial: What Beginners Should Know First
- Google Analytics (GA4) is a free web analytics tool by Google that tracks website traffic, user behavior, and conversions.
- GA4 uses an event-based model (replaced Universal Analytics in 2023).
- Track what matters: conversions, traffic sources, engagement rate, bounce rate, and session duration.
- Traffic ≠ growth
- Use UTM parameters for campaign measurement.
- Connect with Google Ads and Search Console for deeper insights.
- Review weekly, optimize funnels and CTAs consistently.
- Analytics is ongoing and not a one-time setup.
Google Analytics Tutorial: What It Is and Why It Matters
That’s exactly why following a structured Google Analytics tutorial is critical instead of randomly clicking through reports.
Google Analytics is a free tool by Google that helps small businesses track website traffic, user behavior, and conversions.
In this Google Analytics tutorial, you’ll understand both the technical setup and the strategic side of data interpretation. It shows where visitors come from, what they do on your site, and whether your marketing efforts are generating real business results.
It’s easy to get confused and think GA4 and Google Analytics are two different tools.
Quick answer: They are not different. GA4 is the latest version of Google Analytics.
Earlier, Google had a version called Universal Analytics (UA). Now, that older version has been replaced by Google Analytics 4 (GA4).
To understand more, you may read Google’s official GA4 documentation.
You can explore detailed explanations directly on the official Google Analytics Help Center
The #1 Mistake Small Businesses Make
The worst mistake Google analytics for beginners can make is not having a GA4 account.
Because without it, you have no real metrics to understand how your business is performing or what needs fixing.
It leaves website owners blind.
Studies show that 77% of users value data transparency, and businesses that actively analyze customer data achieve 126% higher profit growth compared to those that don’t.
That’s a massive gap to ignore.
Without a proper GA4 setup, you cannot:
- Measure ROI on marketing campaigns
- Optimize user experience
- Identify performance gaps
- Make confident, data-driven decisions
All of this will burn a hole in your pocket more than you think.
Another costly mistake businesses make is:
- Obsessing over page views
- Checking traffic daily
- Ignoring conversions
- Never setting up goals
More data does not equal more clarity. If you track the wrong metrics, you’ll make the wrong decisions.
Vanity Metrics vs Growth Metrics
| Vanity Metrics (Feel Good) | Growth Metrics (Make Money) |
|---|---|
| Page Views | Conversions |
| Sessions | Revenue |
| Impressions | Cost per Acquisition |
| Clicks | Conversion Rate |
| Followers | Customer Lifetime Value |
Traffic looks impressive.
Revenue is impressive.
You need to know what to track, when to track it, and how to interpret it. A proper Google Analytics tutorial helps avoid this blind spot from day one.
And that’s exactly what we’ll cover next.
Why is Google Analytics for Beginners a Game-Changer?
What happens to your website data if you switch platforms tomorrow?
If you’re using built-in analytics from website builders like Wix or Squarespace, your historical data stays inside their system.
And if you migrate your website? You lose access to years of traffic insights.
That means:
- No record of which pages performed best
- No data on which campaigns drove sales
- No way to track long-term growth
Google Analytics, on the other hand, stays with you, no matter what platform you use.
Whether you move from Wix to WordPress, Shopify, or a custom site, your data continues uninterrupted.
For small businesses, that’s not just convenient. It’s control.
Also, other platform analytics for beginners provide surface-level information such as total visitor count, general traffic sources, basic page views, etc.
But with Google Analytics, you get comprehensive data showing exactly how visitors use your website, traffic sources, real-time user activity, mobile vs desktop behavior, which marketing campaigns bring paying customers, and more.
The more data you have, the more decisive you can be.
“Google Analytics is the best friend of all Digital Marketers as it dictates the decision making and success of every website.”
– Dr. Chris Dayagdag (CEO of Marketlink Web Solutions)
If you think Google Analytics is only useful for small businesses, you are sorely wrong. Even big giants like McDonald’s use it to analyze its customer data.
“Google Analytics 4 has equipped us with a strong measurement foundation.
We can get valuable insights from our first-party data with machine learning and utilize them in our marketing, driving impressive results to future-proof our business”,
–Tina Chao, McDonald’s Hong Kong Chief Marketing and Digital Customer Experience Officer.
Google Analytics Tutorial: Step-by-Step GA4 Setup
Creating a Google Analytics account is much simpler than you think (given you follow these steps).
This Google Analytics tutorial keeps the setup process simple, even if you have zero technical background.
Step 1: Sign in to Google Analytics
Log in to Google Analytics using a Google account. Create an account at accounts.google.com if you don’t have one. This will be your main portal to the GA4 property.
Tip: If you already have a Google account for business or another service, use that one.
Step 2: Create a new GA4 property
After signing in, visit analytics.google.com and click on “Admin” in the bottom left and choose the “Create Property” option. Now GA4 will be your default property type.
Step 3: Enter your business details
Fill in the required information, such as your business name, website URL, industry, and time zone. Add your website’s URL if asked and proceed to save your property.
This helps GA4 organize and report your data correctly.
Step 4: Install the tracking code
Once you create a property, GA4 will generate a unique tracking ID. You’ll need to install this on your website so it can start collecting visitor data.
This tracking code will usually be a JavaScript snippet that collects user interactions and sends the data to Google’s servers.
Important:
After installing the code, clear your website cache and refresh the page.
If you don’t see real-time activity in GA4, double-check:
- Code placement inside the
<head>tag- No duplicate tracking scripts
- Correct property ID
A broken setup gives false confidence — which is worse than no tracking at all.
For CMS integration, platforms like WordPress offer plugin-based integration that makes it easy to install tracking code.
For manual installation, paste the JavaScript snippet (tracking code) into the <head> section of your site. You will need to do this manually by switching on HTML code mode.
Step 5: Check the process
Once you’ve installed the code, check your GA4 real-time report to verify your setup. Look for active users and see if everything is working properly.
And voila! Your GA4 account is ready to track.
Pro Tip: If you’re using platforms like WordPress or Shopify, there are plugins and built-in integrations that make this process simple. Otherwise, you can manually paste the tracking code into your website’s HTML (usually inside the header section).
Google Analytics Tutorial: Understanding Key GA4 Reports
The Google Analytics dashboard shows several reports to help you monitor and understand your website’s performance. The goal of this Google Analytics tutorial is not just to show features, but to show what actually matters for business growth.
Some of the main features you should know are:
Home Dashboard:
This is the first thing you see when you open GA4. This provides a quick overview of your site’s performance.
Report snapshot:
This shows a summary of your report data. Customize it to view any data you want, such as your top-selling products, most-viewed pages, most-visited traffic sources, and declining pages.
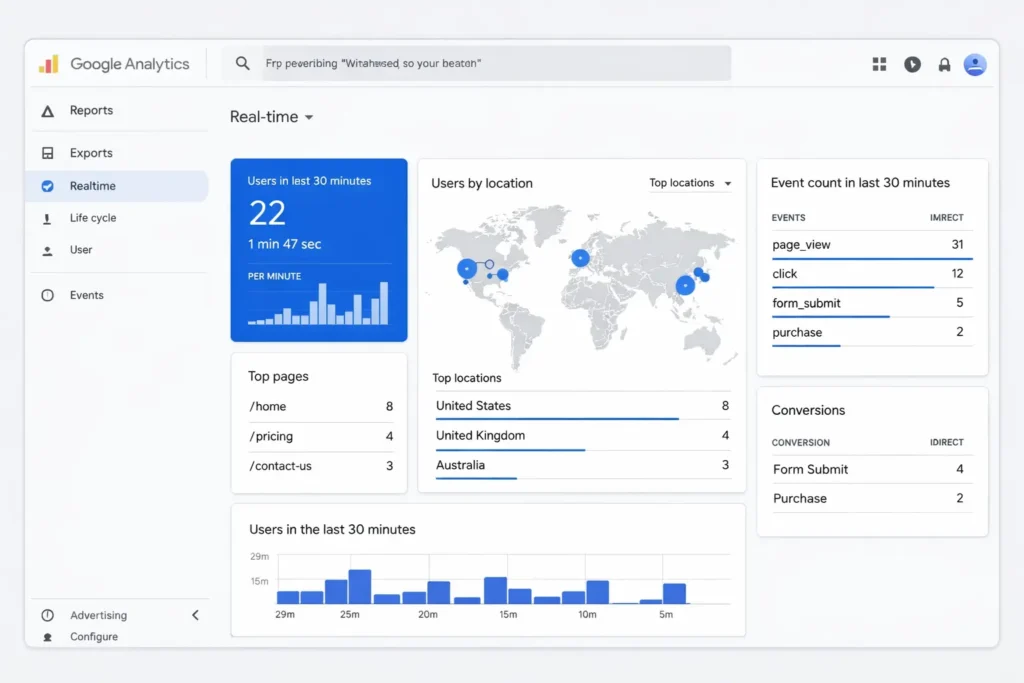
Real-time overview:
This shows which users are currently viewing your site. You will get an understanding of which pages they are viewing, how they found you, how long they stayed, etc.
Life cycle reports: You can view different stages of the customer journey in GA4, like Acquisition (where visitors come from), engagement (how they interact), monetization, and retention.
Google analytics for SEO purpose
Apart from the above-mentioned reports, you need to understand how well your on-site SEO is performing organically. This might be by far the best analytics for beginners.
Check this by navigating to Reports > Acquisition > Overview.
Want to dig deeper to understand more? Go to Acquisition> select Traffic acquisition and scroll to find Organic search. This tells you exactly how your visitors found your website.
To go deeper into how keywords influence that traffic, read this detailed guide on keyword research for beginners.
You may use paid tools like Semrush and Ahrefs to complement GA4 reports and get a well-rounded view of performance, but most of the time, relying on GA4 is enough, especially for small businesses.
If you’re still learning how SEO works alongside analytics, this beginner SEO guide to rank on Google explains the fundamentals clearly.
5 Key GA4 Metrics That Actually Matter for Businesses
If you open Google Analytics 4 (GA4) for the first time, it feels like you’ve walked into an airplane cockpit. That’s why this Google Analytics tutorial focuses only on the metrics that directly influence revenue.
Buttons. Charts. Events. Engagement rates. User metrics.
Confused Already? Quick Clarity Box:
- Users = Individual people visiting your site
- Sessions = Visits (one user can have multiple sessions)
- Events = Actions taken (clicks, scrolls, purchases)
Once you understand this trio, GA4 becomes far less intimidating.
But here’s the truth.
Most businesses only need to track 5 core metrics to understand whether their website is actually driving growth.
Conversions (Are Visitors Taking Action?)
Conversions should be your #1 metric. Traffic is nice, but conversions pay the bills.
Conversions track actions you define as valuable. It could be purchases, form submissions, newsletter sign-ups, downloads, or booking calls.
If you run a digital marketing agency, a conversion might be when users click on:
- “Book a Free Consultation”
- “Download Our SEO Checklist”
- “Request a Quote”
Why This Matters:
You could have 5,000 visitors a month. But if only 5 people contact you, your website isn’t converting effectively.
Tracking conversions helps you answer:
- Which traffic sources bring buyers?
- Which pages lead to sign-ups?
- Which campaigns actually work?
Quick Example:
A small local bakery noticed 3,000 monthly visitors but only 12 orders.
After tracking conversions properly, they discovered most users dropped off on the checkout page.
Fixing the form reduced friction — and orders increased by 38% in one month.
Data didn’t just inform them. It transformed revenue.
Pro Tip: Set up at least 3 micro-conversions, such as newsletter sign-ups, contact form submissions, or WhatsApp click-to-call buttons.
To find conversion rate in GA4, go to: Reports > Engagement > Conversions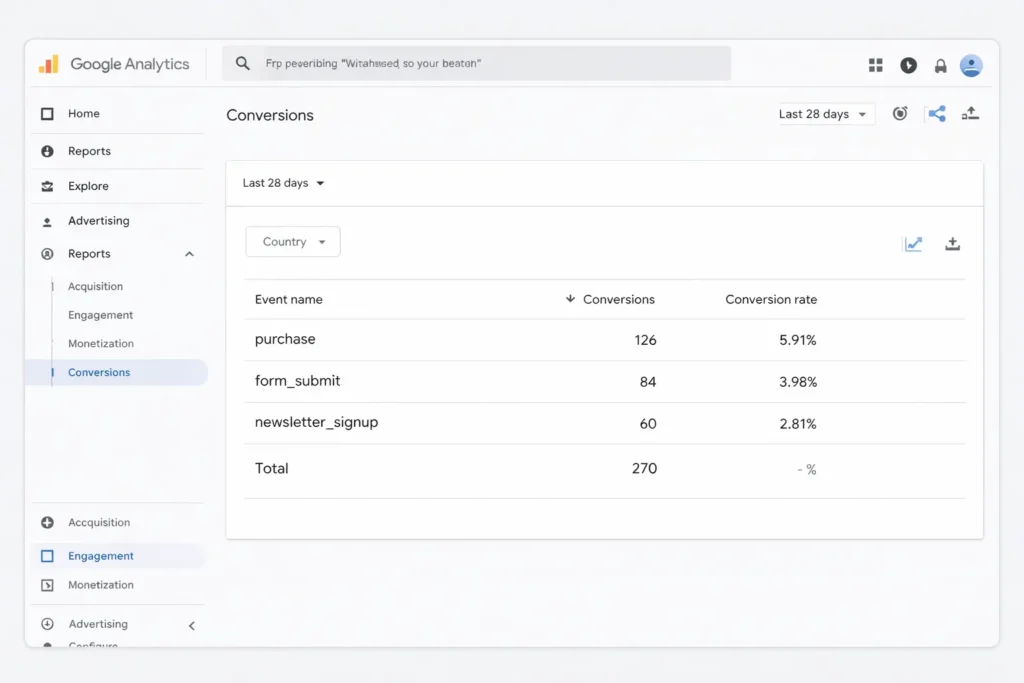
This report shows all the events you’ve marked as conversions (like purchases, form submissions, sign-ups, etc.).
Engaged Sessions (Are People Actually Interacting?)
An engaged session in Google Analytics 4 happens when a visitor stays on your site for more than 10 seconds, views multiple pages, or completes a conversion event.
In simple terms: Did they do something meaningful?
For example, imagine you run a home bakery. Someone clicks your Instagram link, lands on your website, checks your menu, then visits the “Order Now” page. That’s an engaged session.
They didn’t just glance and leave; they explored.
If you’re getting traffic but low-engaged sessions, it could mean:
- Your content doesn’t match what visitors expected
- Your site is slow
- Your messaging is unclear
Pro Tip: If engaged sessions are low, review page load speed, headline clarity, and whether your content answers the user and search intent.
Average Session Duration (Are They Sticking Around?)
This tells you how long users spend on your site.
Longer session duration generally suggests:
- Your content is relevant
- It’s easy to read
- It solves a problem
For example, if you publish a blog titled “How to do X” and users stay for 3-4 minutes, that’s a good sign. It means they’re reading.
But if they leave in 15 seconds, you may have:
- Overwhelming content
- Poor formatting
- Too much jargon
- Or don’t have helpful content
Pro Tip: You can improve session duration by using shorter skimmable paragraphs, proper subheadings, real-life examples, breaking content with bullet points, adding graphics, etc.
To find the average session duration in GA4, go to: Reports > Engagement.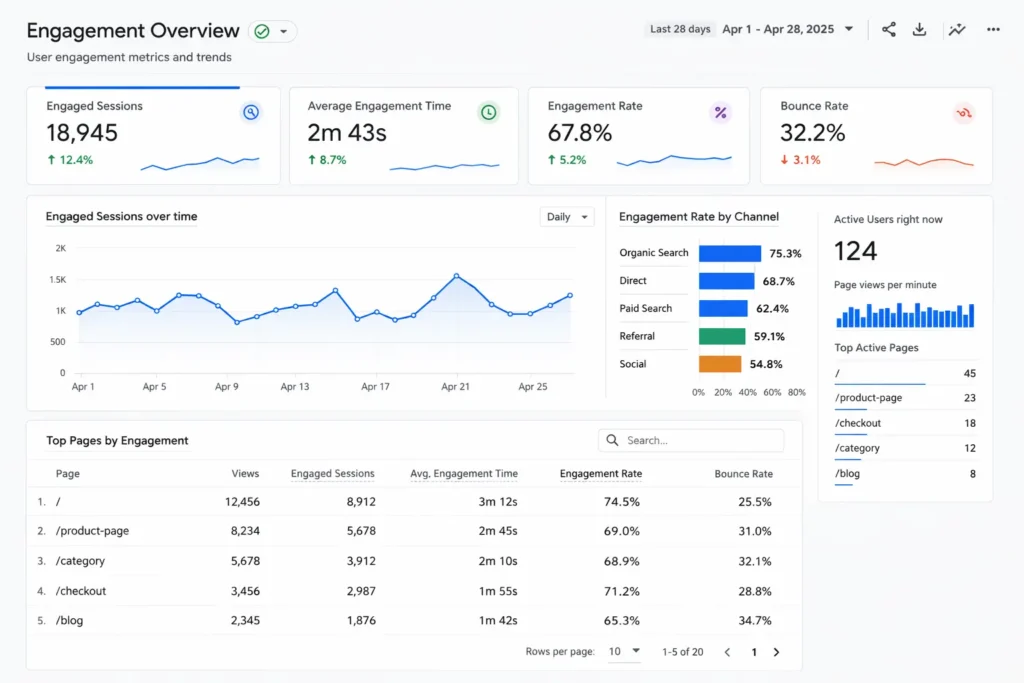
Bounce Rate (Are People Leaving Too Quickly?)
Bounce rate is the percentage of users who leave after viewing only one page (the inverse of engagement rate).
Beginners often misunderstand bounce rate. A high number isn’t always bad because it depends on user intent and page type.
- Typically, the average bounce rate is 41–55%.
- Below 40% is good.
- Above 70% is bad.
If someone reads your blog for 5 minutes and leaves satisfied, that’s still technically a bounce, but it’s not a failure.
When a high bounce rate is a problem:
- Landing pages for ads
- Sales pages
- Product pages
- Service pages
If someone clicks your paid ad and leaves immediately, that’s money wasted.
How to Reduce Bounce Rate:
- Match headlines with ad copy
- Add testimonials or trust signals
- Improve page speed
- Place your CTA above the fold
Small changes can significantly lower bounce rates.
To find bounce rate in GA4, go to: Reports > Engagements > Select Pages and Screens > Add bounce rate metric.
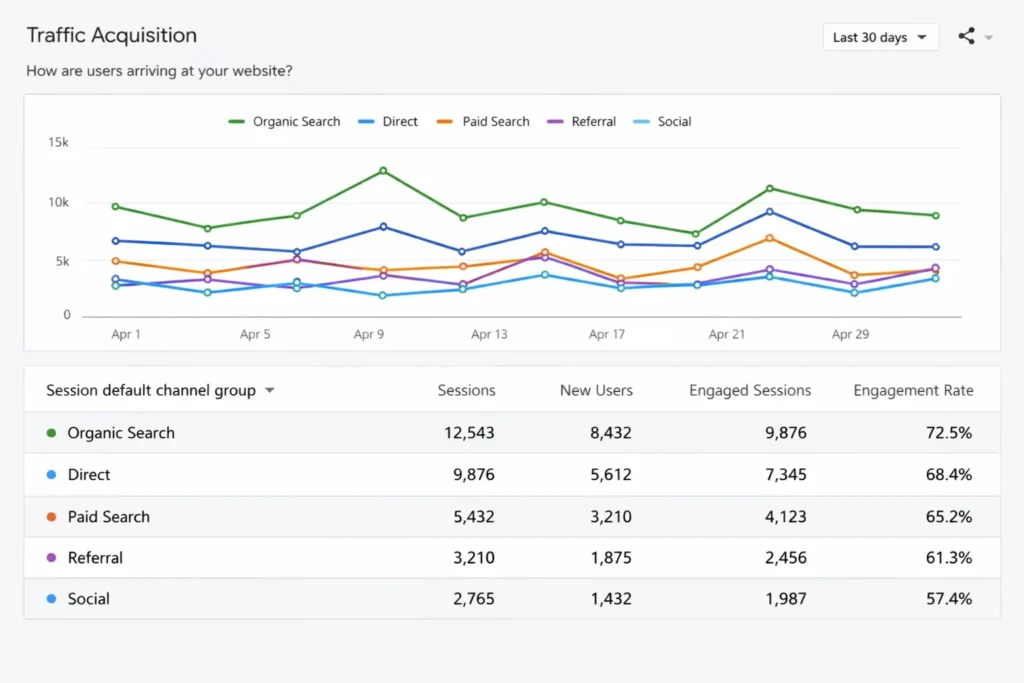
Traffic Source (Where Your Users Come From)
Traffic source tells you how people found your website. And for any small business, that’s gold.
In Google Analytics 4 (GA4), go to Reports > Acquisition > Traffic acquisition.Under the Session default channel group column, you’ll see where visitors are coming from.
Common channels include:
- Organic Search & social – unpaid traffic from search engines and social media platforms
If Instagram is part of your strategy, these practical Instagram marketing tips for small businesses can help improve engagement and conversions. - Paid Search – clicks from ads such as Google Ads
- Direct – users typing your URL or using bookmarks
- Referral – visitors from other websites
- Email – traffic from email campaigns
Not building an email list yet? Here’s a beginner-friendly guide on how to build an email list from scratch.
Pro Tip: For more detailed data, change the primary dimension to Session source/medium to see exact sources like google/organic, linkedin/referral, or newsletter/email.
By this stage of the Google Analytics tutorial, you should understand setup, reporting, and essential metrics.
It might be a good time to bookmark this Google Analytics 4 tutorial. Still more to learn.
How to Measure and Track Marketing Campaigns in GA4?
Define What “Success” Means for You
Every business is different. Your success metrics could be:
- Sales
- Lead submissions (contact form, email sign-ups)
- Downloads (guides, ebooks, tools)
- Phone calls or WhatsApp clicks
- Add-to-cart actions
In GA4, these are called conversions. Make sure you mark the actions you care about as conversions.
Connect the GA4 account with Google Ads (If You Run Ads)
If you’re currently running campaigns but not seeing results, you might be making some common Google Ads mistakes beginners make.
Linking GA4 with Google Ads allows you to:
- See which ads actually lead to revenue
- Calculate Cost per Acquisition (CPA)
- Improve bidding and budget decisions
Without this, you’re guessing. With this, you’re measuring ROI.
For complete integration steps, refer to the official Google Ads Help documentation
Track Funnel Progress (User Journey)
GA4 lets you set funnel reports so you can see:
- How many users entered the buying process
- Where they dropped off
- How many actually completed a goal
For example, if you run an e-commerce business:
Homepage > Product page > Add to cart > Checkout > PurchaseIf most users drop off before checkout, you know exactly where to optimize.
Compare Time Periods
To truly understand growth:
- Compare data month over month
- Look at what changed after a campaign
- See trends over quarters
This shows whether your business is actually improving or just getting lucky.
Analyze Revenue vs. Costs
If you’re running ads or paying for marketing tools:
- Compare revenue generated vs. money spent
- GA4 shows revenue from tracked purchases
- Calculate ROI: (Revenue − Cost) ÷ Cost
This tells you if your marketing tactics make business sense.
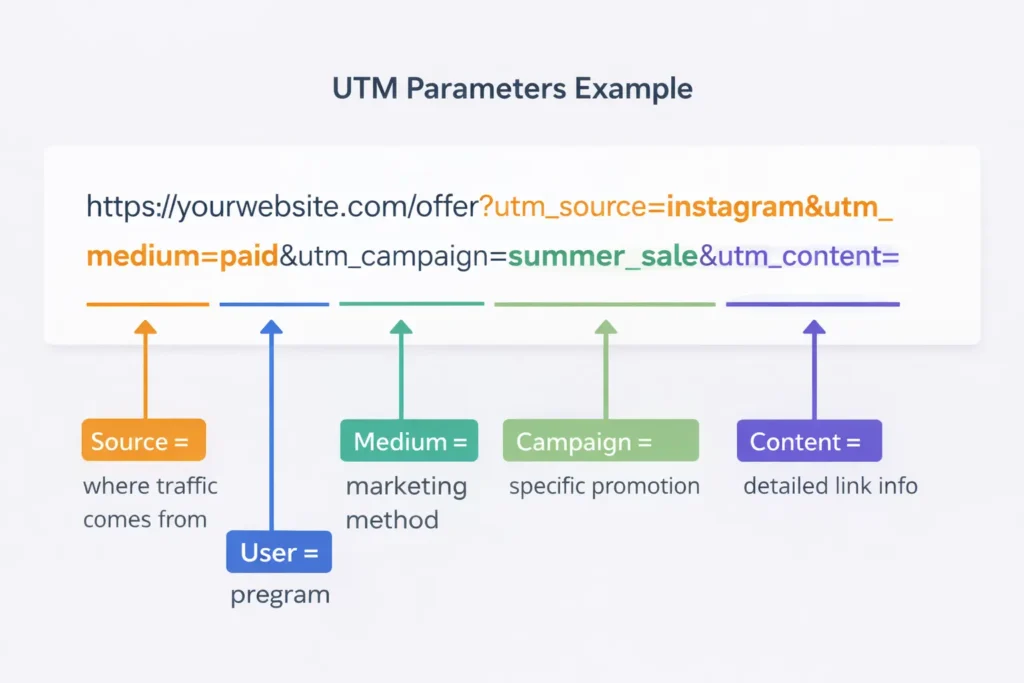
Add UTM Parameters for Your Campaigns
Tag links with UTM Parameters. You can use free UTM builder tools, such as the Campaign URL Builder, to measure the performance of custom campaigns.
Example of UTM parameter
https://yourwebsite.com/offer?utm_source=instagram&utm_medium=paid&utm_campaign=summer_sale&utm_content=video_ad
Track Campaign Reports
Measure how different media drives visits and conversions, and keep doubling down on the ones that show higher conversion. Every Google Analytics tutorial should address mistakes, because wrong tracking leads to wrong decisions.
Common GA4 Mistakes Beginner Should Avoid
At this point, you understand the mechanics.
Now comes execution.
Because analytics only creates growth when it’s reviewed consistently and acted upon strategically.
You can’t make any mistakes when tracking Google Analytics, because it directly influences your business outcomes.
A small error in tracking the wrong metric can turn costly.
Tracking too many metrics: More data does not mean better decisions. Focus on core KPIs: conversions, traffic sources, and engagement rate before exploring advanced reports.
Not creating custom dashboards: Default GA4 reports can feel overwhelming. Build dashboards that display only the metrics aligned with your business goals.
Improper event labeling: GA4 tracks basic events automatically, but key actions must be defined clearly. Use structured names like newsletter_signup, add_to_cart, or contact_call_click to measure meaningful activity.
Not connecting GA4 to other tools: Integrate GA4 with Google Search Console, Google Ads, and Looker Studio for keyword research, campaign performance, and ROI accurately.
Focusing only on traffic: High traffic does not equal growth. Measure conversions, buyer intent, and revenue impact, not just clicks.
Avoiding expert guidance when needed: If GA4 setup feels complex, professional support can ensure accurate tracking and reporting.
30-Day Action Plan for Nailing Google Analytics
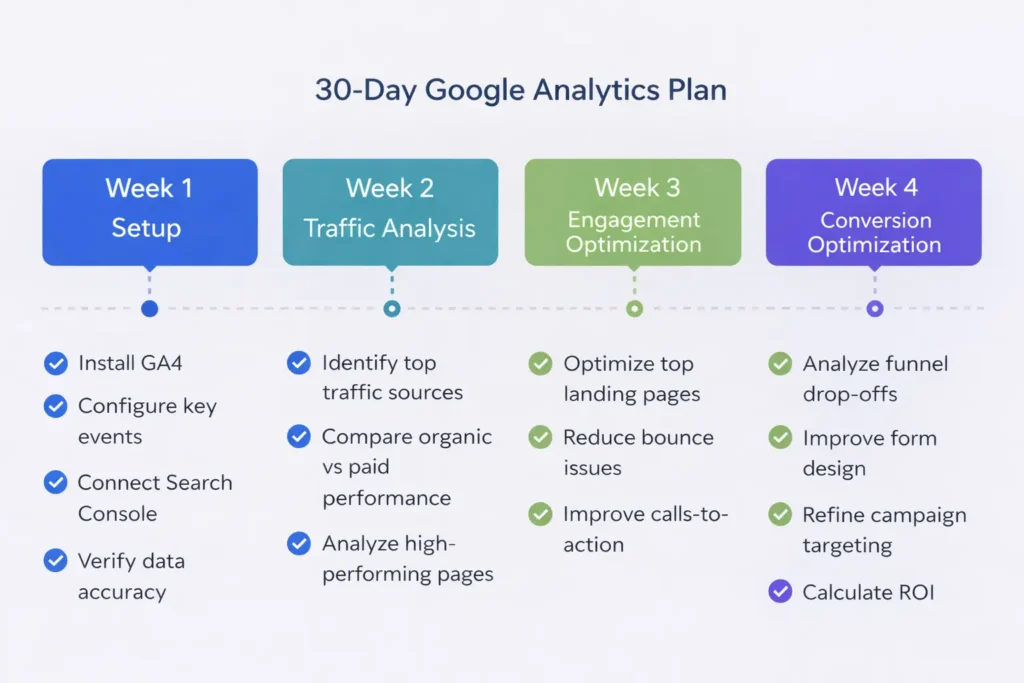
Here’s a practical roadmap of analytics for beginners:
Week 1: Setup & Verification
- Install GA4
- Configure key events
- Connect Search Console
- Verify data accuracy
Week 2: Understand Traffic
- Identify top traffic sources
- Compare organic vs paid performance
- Analyze high-performing pages
Week 3: Improve Engagement
- Optimize top landing pages
- Reduce bounce issues
- Improve calls-to-action
Week 4: Optimize Conversions
- Analyze funnel drop-offs
- Improve form design
- Refine campaign targeting
- Calculate ROI
After 30 days, you should have measurable clarity.
Over to you
This Google Analytics tutorial should give you the foundation to start tracking meaningful data and improving your marketing decisions. If you revisit this Google Analytics tutorial over time, your data confidence will grow alongside your business.
When used correctly, it turns raw data into actionable insights that improve marketing ROI.
GA4 requires ongoing monitoring, not just installation. Review reports regularly, focus on meaningful metrics, and optimize pages based on user behavior and conversion data.
If your GA4 setup feels complex or you’re unsure whether conversions are tracked correctly, consider a professional audit to ensure accurate tracking and performance measurement.
Remember:
Installing GA4 is step one.
Understanding it is step two.
Using it to make better decisions? That’s where real businesses separate from hobby websites.Analytics isn’t about numbers.
It’s about clarity, confidence, and controlled growth.
FAQ
Q: Is GA4 the same as Google Analytics?
A: Yes, GA4 (Google Analytics 4) is the latest version of Google Analytics. It replaced Universal Analytics and uses an event-based tracking model to measure user behavior across websites and apps.
Q: When did Google Analytics switch to GA4?
A: Google officially replaced Universal Analytics with GA4 in July 2023. From that point, GA4 became the default platform for tracking website data and conversions.
Q: Why is Google Analytics important for businesses?
A: Google Analytics helps businesses track traffic sources, user behavior, and conversions to measure marketing ROI. It turns website data into actionable insights that support smarter business decisions.
Q: Do small businesses need data analytics?
A: Yes, small businesses need data analytics to understand what marketing channels are driving real customers and revenue. Without analytics, decisions are based on guesswork instead of performance metrics.
Q: What is a Google Analytics tutorial?
A: Google Analytics tutorial teaches beginners how to set up GA4, track website visitors, analyze traffic sources, and measure conversions.
Q: What is the main goal of Google Analytics?
A: The main goal of Google Analytics is to measure user interactions and track conversions on your website. It helps businesses optimize marketing campaigns and improve customer journeys using real data.